A lightweight, self-hosted status page that monitors HTTP endpoints and displays uptime with tick mark (✓/✗) UI.
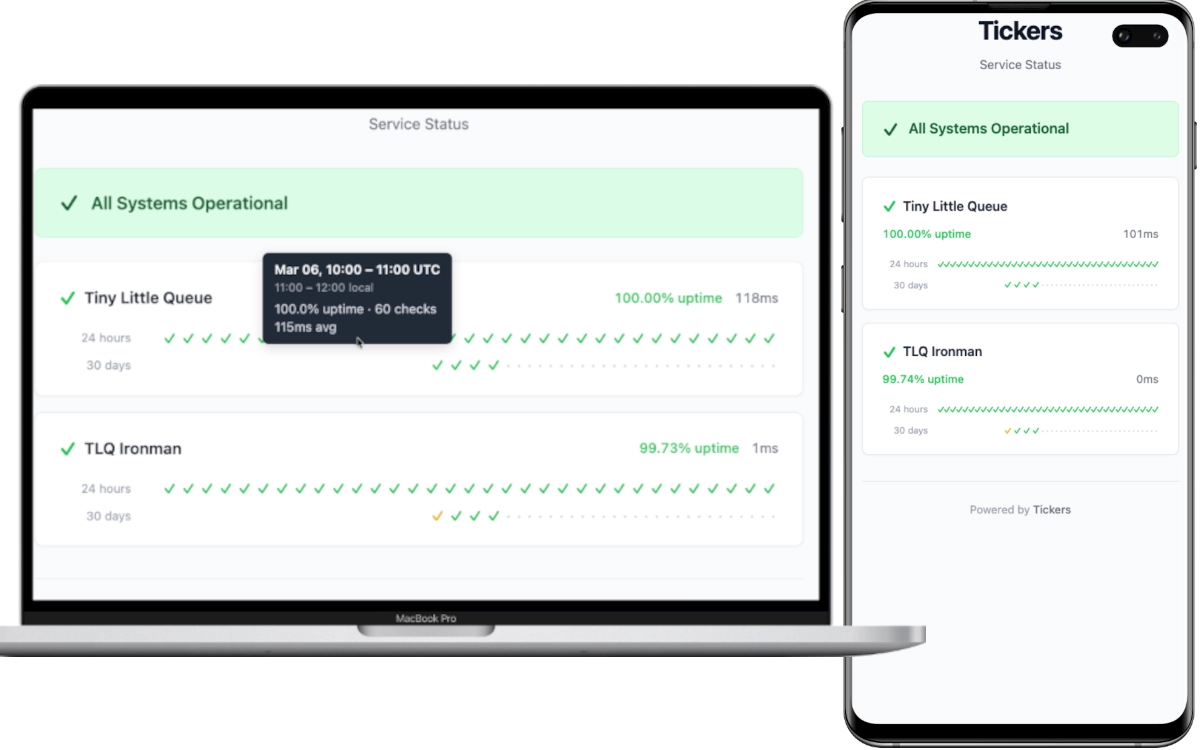
- HTTP endpoint monitoring with configurable check intervals, timeouts, and response body validation
- Tick mark UI — checkmarks (✓) and crosses (✗) colored by uptime percentage
- 24-hour hourly and 30-day daily history rows per service
- Color-coded uptime: green (100%) → yellow (≥95%) → orange (≥50%) → red (>0%) → purple (0%)
- Telegram alerts on detected downtime and recovery — one bot per instance, configurable failure threshold
- Single binary — Rust backend serves the WASM frontend as static files
- SQLite storage with WAL mode — no external database required
- TOML configuration with sensible defaults and per-service overrides
- Docker-ready with multi-stage build and compose support
- Lightweight — optimized release binary with
opt-level = "z"and LTO
-
Create a
tickers.tomlconfiguration file:[server] port = 8080 [defaults] check_interval = 60 # seconds timeout = 10 # seconds [[services]] id = "my-api" name = "My API" url = "https://api.example.com/health" expected_status = 200
-
Create a
docker-compose.yml:services: tickers: image: ghcr.io/skyaktech/tickers:latest ports: - "8080:8080" volumes: - tickers-data:/app/data - ./tickers.toml:/app/tickers.toml:ro restart: unless-stopped volumes: tickers-data:
-
Start:
docker compose up -d
-
Open
http://localhost:8080in your browser.
docker run -d \
  -p 8080:8080 \
  -v ./tickers.toml:/app/tickers.toml:ro \
  -v tickers-data:/app/data \
ghcr.io/skyaktech/tickers:latestTickers is configured via a TOML file. Set the path with the TICKERS_CONFIG environment variable (defaults to tickers.toml in the working directory).
[server]
port = 8080                      # HTTP server port (default: 8080)
static_dir = "./frontend/dist"   # Path to frontend assets (default: "./frontend/dist")

[database]
url = "sqlite://data/tickers.db" # SQLite database URL (default: "sqlite://data/tickers.db")

[defaults]
check_interval = 60              # Default check interval in seconds (default: 60)
timeout = 10                     # Default request timeout in seconds (default: 10)

[telegram]                       # Optional — omit the whole section to disable notifications
bot_token = "123456:ABC-DEF..."  # Bot token from @BotFather (required to enable)
chat_ids = ["123456789"]         # Chats to notify: user/group IDs or "@channel" (required to enable)
failure_threshold = 3            # Consecutive failed checks before a DOWN alert (default: 3)

[[services]]
id = "my-api"                    # Unique service identifier (required)
name = "My API"                  # Display name (required)
url = "https://api.example.com"  # URL to monitor (required)
expected_status = 200            # Expected HTTP status code (default: 200)
expected_body = "ok"             # Expected substring in response body (optional)
# expected_body = "/healthy/i"   # Or use /regex/ syntax, /i for case-insensitive
check_interval = 30              # Override default interval for this service
timeout = 5 # Override default timeout for this serviceEach [[services]] entry defines a monitored endpoint:
| Field | Required | Default | Description |
|---|---|---|---|
id |
Yes | — | Unique identifier for the service |
name |
Yes | — | Display name shown in the UI |
url |
Yes | — | HTTP(S) URL to monitor |
expected_status |
No | 200 |
Expected HTTP response status code |
expected_body |
No | — | Expected response body content (substring or /regex/) |
check_interval |
No | from [defaults] |
Check interval in seconds |
timeout |
No | from [defaults] |
Request timeout in seconds |
Tickers can send a Telegram message when a service is detected down, and again when it recovers. One bot serves the whole instance, and every alert is delivered to all configured chats. Omit the [telegram] section to disable notifications entirely.
Setup:
-
Message @BotFather, send
/newbot, and copy the bot token it gives you. -
Find your chat ID: send any message to your bot (or add it to a group), open
https://api.telegram.org/bot<token>/getUpdates, and readresult[].message.chat.id. Group IDs are negative (e.g.-1001234567890); channels can use"@channelusername"instead. -
Add a
[telegram]section to yourtickers.toml:[telegram] bot_token = "123456:ABC-DEF1234ghIkl-zyx57W2v1u123ew11" chat_ids = ["123456789", "-1001234567890"] failure_threshold = 3
| Field | Required | Default | Description |
|---|---|---|---|
bot_token |
Yes | — | Bot token from @BotFather; empty disables notifications |
chat_ids |
Yes | — | Chats to notify — user/group IDs or "@channel" |
failure_threshold |
No | 3 |
Consecutive failed checks before a DOWN alert |
A DOWN alert fires after failure_threshold consecutive failed checks, so a single transient blip stays quiet. A recovery message fires on the first successful check afterward and includes how long the service was down. Notification state is restored from history on startup, so restarting Tickers won't re-alert an already-down service.
Example messages:
🔴 My API is DOWN
https://api.example.com/health
Timeout after 10000ms
2026-06-03 14:32 UTC

✅ My API recovered
was down for 4m 12s
2026-06-03 14:36 UTC
- Rust 1.94+ (edition 2024)
- wasm32-unknown-unknown target:
rustup target add wasm32-unknown-unknown - Trunk:
cargo install trunk
-
Start the backend:
cd backend cargo run -
In a separate terminal, start the frontend dev server:
cd frontend
trunk serve
The frontend runs on
http://localhost:3000and proxies/apirequests to the backend on port 8080.
# Build frontend WASM
cd frontend
trunk build --release

# Build backend binary
cd ../backend
cargo build --release
The release binary is at target/release/tickers. It serves the frontend from the static_dir configured in tickers.toml.
docker build -t tickers .
docker run -p 8080:8080 -v ./tickers.toml:/app/tickers.toml:ro tickersAll endpoints return JSON.
Returns the current status of all monitored services.
{
  "services": [
    {
      "id": "my-api",
      "name": "My API",
      "url": "https://api.example.com",
      "is_up": true,
      "status_code": 200,
      "response_time_ms": 142,
      "error_message": null,
      "last_checked": "2026-02-28T12:00:00Z"
    }
  ],
  "overall_status": "all_operational",
  "generated_at": "2026-02-28T12:00:01Z"
}
overall_status is one of: all_operational, partial_outage, major_outage.
Returns hourly aggregated uptime data for the last 24 hours.
{
  "services": [
    {
      "id": "my-api",
      "name": "My API",
      "buckets": [
        {
          "timestamp": "2026-02-28T11:00:00Z",
          "total_checks": 60,
          "successful_checks": 59,
          "uptime_percentage": 98.33,
          "avg_response_time_ms": 145.2
        }
      ]
    }
  ],
  "generated_at": "2026-02-28T12:00:01Z"
}Returns daily aggregated uptime data for the last 30 days. Same response shape as the hourly endpoint, with date-level timestamp values (e.g., "2026-02-28").
tickers/
├── backend/           # Axum HTTP server + health check workers
│   └── src/
│       ├── main.rs    # Entrypoint, server startup, graceful shutdown
│       ├── config.rs  # TOML configuration parsing with defaults
│       ├── db.rs      # SQLx/SQLite pool, queries, migrations
│       ├── worker.rs  # Per-service check loops + data purge task
│       ├── error.rs   # Error types and Axum error responses
│       └── api/       # HTTP handlers and response models
├── frontend/          # Leptos CSR (WASM) single-page application
│   └── src/
│       ├── lib.rs     # App root, data fetching, tiered polling
│       ├── api.rs     # HTTP client and response types
│       └── components/
├── migrations/        # SQLx SQL migration files
├── Dockerfile         # Multi-stage: frontend WASM → backend binary → slim runtime
└── tickers.toml       # Example configuration
The backend spawns one async task per monitored service, each running an independent check loop. A separate task purges data older than 90 days every hour. The frontend compiles to WASM via Trunk and is served as static files by the backend's Axum router, with API routes taking priority over the static file fallback.
This project is licensed under the MIT License.